The optimum method to diagnose and mitigate environmental noise problems
Most noise investigations, whether in answer to noise complaints or when setting or meeting noise specifications, do not include basic diagnostic good practice. Consequently, as the end results are therefore largely based on guesswork, this can cause unnecessarily high health and fiscal costs.
The following is the detailed diagnostic process that must be followed to ensure that both the precise causes of the noise issues are identified and that Best Practicable Means (BPM) can be implemented where mitigation is required.

What are the key identifiable noise characteristics?
There are only 2 broad types of noise characteristic to check, namely amplitude (including variation in) and frequency content.
Amplitude: dB(A) plus any variation in the amplitude of the broadband noise. Whilst adequate information can often be acquired quite quickly, there is a tendency to log noise data over unnecessarily long periods. This particularly inappropriate (and costly) when the noise problem is not governed by dB(A) - which should have been determined before scheduling extensive logging.
Environmental noise diagnosis
Get a free remote control diagnosis
Frequency content: broadband and/or tonal features. Neither the commonly used subjective impression (does the noise sound tonal?) nor the BS4142 1/3 octave method are reliable. Moreover, they do not provide the diagnostic information that is absolutely crucial for both problem identification and mitigation. Narrow band analysis is a non-negotiable requirement.

BS4142: this is an unnecessary costly and time consuming assessment where there are justified noise complaints. The objective is to determine and eliminate the precise causes of the complaints, not to indulge in a long, drawn out process simply to come to the obvious conclusion that "complaints are likely".
Parts 1 and 2 of the procedure described below can be carried out by almost anyone as very little specialist knowledge is required. It is only part 3, the mitigation process, that requires more specialist engineering expertise.
Part 1: how to create a “complaint /noise problem signature”
Once you have discussed the problem with the complainant or established the details of the noise specification:
- Measure and listen at the complainant or monitoring point. If the issue is indoor complaint driven, this should ideally take place inside the premises. If this is not possible, compensate for the fact that the noise will sound bass-heavy inside.
- Always record audio for subjective and potential future additional analysis, otherwise your measurements and analyses are only providing and edited version of the data. We also use complainant smartphone recordings from across the planet as part of this process to save site visits and having to stay awake at 2am...
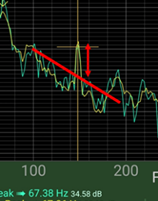
- Always carry out a narrow band frequency analysis to ID possible tones (or none), their precise frequencies and their amplitudes above the background noise around that frequency. This is easily achievable using a free smartphone app as shown here.
- Combine the above to determine the precise noise features that are the cause of the complaints, the “complaint signature”.
"Complaint signature" creation process example

Resident complaints about “hum” resulted in multiple noise reports that ascribed the problem to a nearby large industrial site that was then subject to regulatory action – but without any source identification as the reports were based on inadequate 1/3 octave analyses.
Our narrow band analysis proved that the problem was actually 2 tones at 71Hz and 75Hz as shown here, not the single assumed “hum”. The 75Hz tone was identified as the exhaust of a diesel generator set on the site, simply solved by fitting a tuned exhaust silencer.
The 71Hz tone was identified as the fan blade pass for a chiller on a completely different site, easily mitigated using aerodynamic noise control.
Not following the diagnostic process led to considerable unnecessary expense (noise reports), wasted regulator resources and a delay of over a year in eliminating resident stress.
Part 2: how to diagnose the cause(s) of “complaint signature” characteristics
Identify contributory site plant noise sources and characteristics, be it a simple takeaway café extract fan or from an entire industrial site. Then rank the sources (if there are multiple potential contributors) – against noise specifications and by subjective effect - dB(A) and character at the complainant, site boundary or other reference position.
How to identify and rank the noise source(s)
- On/off: the simplest technique (where practical) is to turn the suspect source(s) on and off and evaluate the effect at the complainant or reference position. Sometimes it is possible to schedule the order of plant operations during a normal site shut or startup. By recording audio for later analysis, off time can be minimised to perhaps 30 seconds.
- Amplitude – broadband: measure each source close in (at the correct distance) and predict noise levels (sound power and propagation) off site. For varying or intermittent sources, use the timing or simultaneous audio recording on and off site.
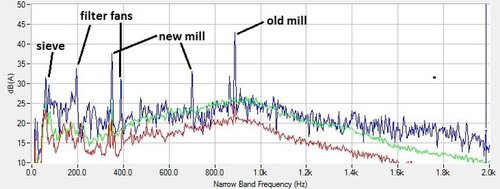
- Frequency content – tonal: if the problem is tonal then this is the simplest and easiest diagnostic technique. Match the precise frequency of problem tones with tones from the potential sources to generate a positive ID. As the tones will be associated with a mechanical or aerodynamic process on the item of plant, this also provides invaluable information as to the noise control options.
- Rank multiple sources: in order of their contributions to the offsite issue
"Complaint signature" diagnostic process example
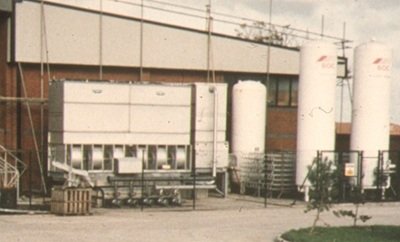
These 2 new cooling towers caused noise complaints from residents opposite. The consultant report (no ranking process) recommended outlet silencers and a noise barrier at the boundary to achieve a predicted noise level of 56dB(A).
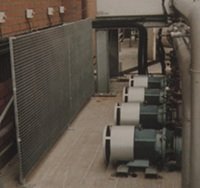
We ranked the sources through a combination of briefly running each tower separately, broadband noise prediction and frequency analyses. The ranked contributions were 1: air outlets, 2: air inlets, 3: fan motors, 4: main pumps 5: lift pumps.
The inlets and outlets were fitted with absorbent panels; pump motors fitted with simple silencers and a wall lined with absorbent to reduce reflections. Following this diagnostic process cut the cost by > 80% and achieved > 4 times the attenuation (down to <50dB(A)).
Part 3: the mitigation process
If the above process has been carried out, then the next step is define precisely what would constitute Best Practicable Means (BPM) or Best Available Technology (BAT) to mitigate. Without this process, then mitigation is largely based on guesswork...
- Identify all potential noise sources within the dominant machine / process
- Rank these sources in terms of their contributions
- Establish the noise control options for the dominant source.
- Repeat for the next most dominant source
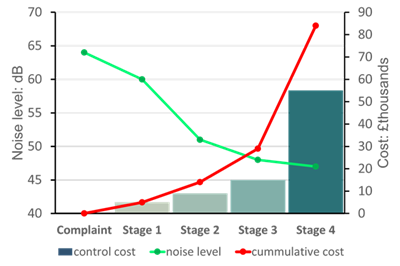
- Use these results to generate a cost benefit analysis of the noise reduction options and their impact v cost based on Best Practicable Means (BPM) engineering, not just on costly conventional palliatives (barriers, enclosures, silencers etc). In this case, BPM would be achieved at around the stage 2 modifications as additional expenditure would provide little added benefit.
