How to update simplistic dB(A) specifications to prevent noise complaints
The classic "A" weighted noise level measurement is often used worldwide as the sole criterion to specify and evaluate the environmental noise impact of proposed or existing sites.

This is the elephant in the global noise evaluation room. Noise ordinances and regulations simplistically (and ineffectively) just set maximum daytime and nighttime dB(A) noise level requirements.
All too often, despite the regulatory noise levels being met, this results in a deluge of noise complaints from the local community, coupled with associated health issues and pressure on regulator resources.
Why specifying just the "A" weighted noise level is inadequate
The "A" weighting is a sound level meter frequency filter designed to evaluate how damaging a sound would be to your hearing. As your hearing is much less sensitive to lower frequencies, it progressively filters out these low frequencies - like a graphic equaliser used to turn down the bass.
Tonal noise and dB(A)
Get a free remote control diagnosis
Sound file: low frequency (100Hz, 300Hz) and higher frequency (1000Hz) tones
Unfortunately, in the environmental wild, low frequencies travel the furthest, diffract round barriers, pass through windows with little attenuation and are a major cause of noise complaints. But the "dB(A)" criterion is largely deaf to these critical low frequencies. It doesn't measure them. This is the equivalent of looking at a rainbow through a filter that eliminates the colour red or designing a piano with the bottom 8 keys removed...
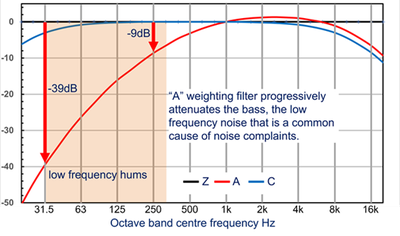
This plot shows how the filter works. The X axis is frequency or pitch, from low to high, the Y axis is amplitude (dB). The black (Z) line is unfiltered, the "A" filter (red line) progressively attenuates lower frequencies - down to 1/8000th of the level at 31.5Hz (-39dB), to 1/8th of the level at 250Hz (-9dB) whilst leaving 1000Hz unchanged. The typical "hum" frequency range is marked in orange (play the above sound file to hear examples).
dB(A) ignores the very hums that cause complaints
Data center hum outdoors and then indoors: 118Hz cooling fan tones
Listen to this recording that illustrates the impact of low frequency tonal noise from a Data Center in the community that meets the dB(A) requirements! Is that acceptable? Would you complain?
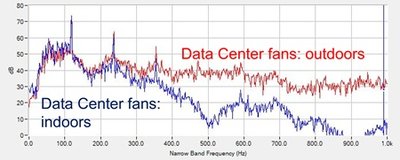
This plot shows the narrow band frequency analysis of the above recording. As above, the X axis is frequency (low to high) and the Y axis is amplitude. The large spike at 118Hz is the primary fan tone (the "hum" plus lesser harmonics at double and treble the frequency). Passing this sound through windows (as in the sound file above) progressively attenuates higher frequencies, making the hum even more dominant - and even more annoying as it's there 24/7 - you can't escape by moving indoors. Imagine trying to sleep with that in your head...
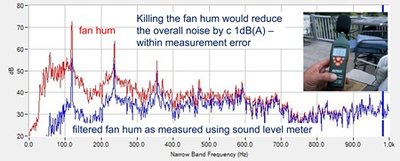
This narrow band frequency analysis plot shows the effect of a sound level meter "A" weighting on the Data Center noise signature. Comparing the weighted plot (red) with the "A" weighted blue trace shows how the filtering dramatically reduces the amplitude of the low frequency hum. In fact, in this case removing the hum tones only cuts the overall meter measured dB(A) by about 1dB, a negligible change that is within measurement error.
Without the hum, an ordinance compliant dB(A) noise level and no complaints. With the hum, widespread complaints for a noise with exactly the same measured dB(A).
Low frequency tonal noise mitigation failure - yet another elephant!
It is a sad fact that noise control recommendations for low frequency hum sources are often ineffective due to a lack of diagnosis compounded by a lack of understanding of physics.
Why are traditional noise control measures ineffective for LF tones?
A typical chiller fan hum at 64Hz (common 4 blades, synchronous motor at 960rpm) has a wavelength of >5m. Traditionally, this means:

- conventional silencers: would have to be 1 - 2 wavelengths long i.e. >5m + added backpressure, reducing fan efficiency. Not the tiny silencers usually recommended (often with an acoustic enclosure) that only cut dB(A) (mid-high frequencies) with no effect on the hum.
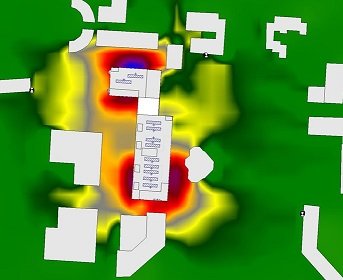
- acoustic barriers: would have to extend perhaps 5m above the fans to provide significant attenuation. Massive... The barrier shown here is classic illustration of the lack of diagnosis and understanding that wasted $5million dollars on an eyesore that had zero effect on noise complaints.
In these cases, the only practical solution is retrofit aerodynamic modifications that can even improve fan efficiency, reducing running costs...
How to add simple tonal analysis to dB(A) to reflect real world noise nuisance
There are complex international standards covering this option, e.g. ISO BS4142 (Methods for rating and assessing industrial and commercial sound) + ISO / TS 20065 (Objective method for assessing the audibility of tones in noise – Engineering method). Whilst they provide highly technical methods using sophisticated and expensive instrumentation, it's possible to get virtually identical results very simply at zero cost and with little or no significant noise expertise.
In addition to complex narrow band analyses, standards such as BS4142 (UK) also suggest that tones can be evaluated by a) listening or b) using 1/3 octave analysis. Unfortunately, our experience is that people (even noise consultants) can be very bad at judging tones by ear and 1/3 octave analysis is ancient tech that is very unreliable as a tone detector.
Keep it simple...
The simple solution is to bypass both of these suggestions and use a free narrow band analysis app on a smartphone. This is not only simple, it is a very reliable and accurate way to both detect and evaluate tones.
The basic principle is very simple. This plot shows a narrow band noise analysis (using professional analysis software) of a sound that includes a classic fan drone at 148Hz. To identify that there is a tone and to determine just how annoying it might be, the frequency resolution has been set to between c 2Hz and 3Hz for the analysis.
The sound sample is averaged over several seconds to give this result at the required location (e.g. at a site boundary or in the community). Eyeball the average broadband noise either side of the tone (the red line) and estimate the amplitude of the tone above this value as shown.
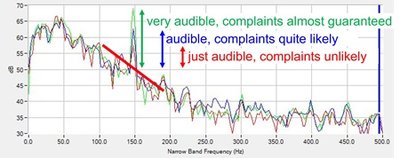
- around 5dB or so, the tone may be just audible: complaints are unlikely
- around 10dB - 15dB, the tone will definitely be audible: complaints are very possible or highly likely depending on the local circumstances
- around 15dB - 20dB or more, the tone will be very audible: extensive complaints almost guaranteed
While these figures are approximate, they are infinitely better than using just dB(A), or listening, or using 1/3 octaves.
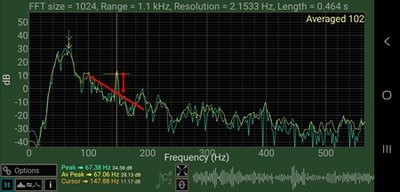
This simple analysis method can be used at no cost by anyone with a smartphone. This screenshot is of a similar analysis using a free Android FFT app and it gives the same result as the costly professional software shown above. There a fan tone at 148Hz that is around 10dB above the estimated broadband average (red line) so it is audible and complaints are possible.
We have tested numerous free Android apps and, whilst there are others, we have provided detailed guidance as to how to download and use our favoured spectrum frequency analysis app.
Policing noise from sites and plant
Regulators or local residents can use this approach very effectively to evaluate the character of environmental noise in addition to any formal dB(A) measurements. In addition to providing objective evidence of any tonal content in the sound, the results also provide invaluable diagnostic information to identify the precise causes of the tones. This makes it much easier to determine the options to mitigate the problem, which in turn, means that a rapid resolution is much more likely.
We use this approach to solve environmental noise problems across the planet quickly and without site visits.
We regularly run short webinars covering on the optimum approach to evaluate and solve noise complaints.
Assessment accuracy
Noise instrumentation suppliers and many noise consultants do not like smartphone analysis apps.
Whilst the reasons for the negativity of the former are fairly obvious, many of the latter do not use or understand FFT frequency analysis and are hung-up on calibration, frequency range linearity and other technicalities. Whilst there are limitations, these criticisms are irrelevant for this particular application. This is particularly the case when compared with the notoriously inadequate "subjective judgement of tonal noise".
The proof lies in our success in using this approach for countless projects across the planet and in training many regulators who now use the techniques. You can view a detailed rebuttal of the arguments used by vested interests about the accuracy of smartphone frequency analysis apps.

Noise regulation, specification and ordinances
The above approach can be included very effectively in all of these circumstances to provide results that are infinitely more reflective of the impact of environmental noise from any industrial or commercial site on communities compared with using just the all-to-prevalent simplistic dB(A) specification.
Change the approach - put the responsibility where it belongs
Write into noise specifications this statement: "Unless you (the developer) can prove that there are no significant tonal components, a noise penalty of 6dB(A) will be applied".
That proof must be based on narrow band frequency analyses.
Problem
- the number of suppliers who provide narrow band noise data for their plant is effectively zero.
- they only provide dB(A) and (often) octave bands. No information on tonality.

Simple solutions
- request they acquire short smartphone audio or video recordings of similar plant installed anywhere in the world
- analyse (as above) to ID any tonal content
- or use full fat acoustic measurement and analysis software to get the same result
On the other side of the fence, the developer should be using an effective Buy Quiet process.
