How to identify noise tones, their source(s) and the best control methods
If there is the possibility of tones from noise sources (a very common cause of complaints), any environmental noise investigation (e.g. BS4142) that does not include narrow-band frequency analyses is, by definition, not fit for purpose.
Consequently (as confirmed by the recent Environment Agency report survey), the lack of narrow band analysis in most reports is one of the reasons that 95% of consultant noise reports are inadequate. Key reasons for this truly depressing statistic are:-
- Subjective impact: human perception of tonal noise, hums, drones, whines etc is fundamentally narrow-band. Consequently, the only effective way to evaluate the effects of tonal noise is to use narrow-band analysis. Using subjective impressions (as per BS4142) is unreliable and open to abuse
- Objective evaluation: narrow-band noise signature analysis provides an objective value closely correlated with the subjective impact and tells you exactly how much frequency-specific attenuation is required. Why guess when it is so easy to pull out a phone and confirm?

- Source identification: tonal analysis provides an instant and precise diagnosis of the source(s) of the tone(s). This takes minutes compared with days or weeks (or never) without this analysis. Octaves are of no use and 1/3 octaves are of very little use - and then only if you're lucky...

- Noise control: spectrum analysis and interpretation also reveals the precise cause of the problem within each source, an invaluable aid to determine the optimum mitigation technology
Note: low-frequency tones (< c 300Hz) cannot be reduced effectively using conventional silencers or barriers as the wavelength of the sound is large. In addition, they don't contribute much to dB(A). You must find out if there are low-frequency tones present.
A swift resolution to complaints
In addition, this form of analysis massively reduces the resources spent on complaint investigation and cuts the time taken to resolve those complaints from months or years down to a few days or weeks. We run webinars on audio diagnosis, including narrow band frequency analysis.
It is also a noise source diagnosis and control scalpel compared with crude octave or 1/3 octave analyses that discard so much key information.
Tonal noise analysis
Get a free remote control diagnosis
Your problem may already be solved
Search our worldwide best practice options
Keep current with best practice innovation
Subscribe for the latest in techniques and best practice
1/3 octave tonal analysis is unreliable, antediluvian technology...
50 years ago, 1/3 octaves were cutting edge on sound level meters and narrow band frequency analysers cost as much as a car. Now you can either buy spectrum analysis software (at moderate cost) or simply download a very effective free smartphone app.
The latter is perfectly adequate for 95% of applications a) to confirm whether there is a tone or not and b) to determine the exact frequency (free apps are as accurate as pro software to identify tonal frequencies). BS4142 says you can use 1/3 octave to identify tones. Don't. It often doesn't work and you also lose the diagnostic data provided by narrow-band analysis. According to the 1/3rd octave method, there are zero tones in this plot - which is completely wrong...

Why look for tones using 1/3 octaves when it often doesn't work and you can be both accurate and precise using a free app?
How to carry out narrow-band frequency analysis
The following is a simple, practical guide to the use of tonal noise analysis. There are a number of options.

Instant analysis in the field
- Use the built-in sound level meter (SLM) software, provided you have a suitable (and expensive) SLM. This provides amplitude calibrated levels.
- Use a free frequency analyser app on your smartphone. Whilst not amplitude calibrated, the tonal frequencies and the tonal level above background (which are all you need) are as precise as on an SLM. You can view our guide to downloading and using the best free Android FFT app we have tested here >
Record sound samples for post analysis

- SLM: if you have a suitable meter, record audio files (16-bit or higher resolution). To reduce file size, choose the lowest available sampling rate (e.g. 11kHz). The maximum frequency available from the recording is c half the sampling rate. At 11kHz sampling, for example, the maximum frequency is c 5000Hz which is fine for environmental noise.
- SLM to audio recorder: use a low-cost audio recorder (from c £100 - must have a 16-bit wav file option) to upgrade any SLM with an AC output socket. Connect the AC line out on the SLM to the recorder (simple cable), disabling any built-in auto gain control and set the sampling rate as in 1 above. In conjunction with your SLM acoustic calibrator, this allows you to record calibrated sound files.

- Audio recorder: as described in 3 above, but use the inbuilt microphones. The uncalibrated amplitude is almost never a problem.
- Smartphone: app audio clips are fine, as long as the file format is 16-bit or higher. There will be a roll-off in amplitude below c 200Hz that varies between phones, but this is not usually an issue. Uncalibrated amplitude but suitable for the vast majority of projects.
Send us your sound or video samples for analysis
Simply email us your recording(s) and we will carry out the narrow-band frequency spectrum analysis for you. These can be in any audio format or even short smartphone video clips from which we extract the audio. We'll then provide you with the results and even potential sources and noise control options.
How to interpret narrow-band frequency noise signatures
Anyone can diagnose the cause(s) of complaint-causing tonal noise, quickly, simply and at no cost. You can learn how from our short noise analysis webinars.
We have the expertise to use sophisticated analysis and noise signature fingerprinting not only to identify the culprit plant, but also the precise cause of the tonal noise - e.g. out-of-balance, fan blade pass, compressor tones, gearbox gear mesh, worn bearing, blower or pump harmonic, vibratory sieves or feeders, gen-sets, acoustic or structural resonance, burner or combustion noise etc. You can benefit from this expertise by using our email analysis and diagnostic service to get both the diagnosis and the costed noise control options.

However, there is just a handful of common tonal noise sources that anyone (even noise consulants) can identify from the frequency signatures.
- fan blade pass = number of blades on the impeller x fan speed + harmonics
- synchronous electric motors: c 49Hz, 24.8Hz, 17Hz + harmonics (for 50Hz mains frequency) depending on the number of motor poles
- out-of-balance: rotational speed
- chiller compressors: usually c 245Hz or 294Hz and harmonics (50Hz mains)
- mains hum (transformers etc): 100Hz and harmonics, with 200Hz often the dominant component. Sometimes multiples of 50Hz.
- gen-sets: multiples of 25Hz (50Hz mains)
Important note: mains hum and gen-set tones are all at exact multiples of 50Hz and 25Hz as they are locked to mains frequency, whereas fixed speed synchronous motors run at slightly lower than mains frequencies. This is a useful diagnostic tool as, provided you use a frequency resolution of < 0.5Hz, a 50Hz tone is electrical whereas a 49Hz tone is mechanical (a motor).
Frequency analysis resolution - fan source identification example

Noise complaints caused by a large industrial site. We requested an off-site smartphone recording plus recordings close to suspect items of plant by email.
- Analysis: the problem is a tone at 298Hz + harmonic at 596Hz
- Diagnosis 1: the tones matched those of just 2 of the site fans with 12 blades running at 1490rpm. The other fans were not implicated
- Diagnosis 2: more detailed analysis of the off-site noise with 0.2Hz resolution showed that both peaks were actually double tones as each fan is running at a very slightly different speed. This causes "beating" whereby the tonal level varies at a frequency that is the difference between the 2 frequencies. Invariably caused by 2 identical sources in close proximity.
- Diagnosis 3: the complaint causing tones only contribute 1dB(A) to the overall noise level, so the dB(A) noise reduction specification was not appropriate
- Noise control BPM: conventional silencing would be extremely costly, would reduce fan efficiency and would be ineffective at reducing the tones, so complaints would still be likely. Aerodynamic control would permanently kill the tones at a fraction of the cost and without affecting efficiency
This whole process is a simple, fast and effective way for anyone to determine the precise cause of complaints. You can then either search our online case studies for potential best practice solutions or you can send the data to us so we can then add the costed noise control options.
Narrow-band tonal analysis - right and wrong fans

EHO threatened abatement notice due to noise complaints - the company had bought ineffective noise control (enclosure and silencer). We requested recordings near the fans and in the complainant bedroom.
- Analysis 1: the problem is a tone at 296Hz + harmonic at 592Hz
- Diagnosis 1: the tones matched the enclosed fan - 6 blades running at 2960rpm
- Solution 1: aerodynamic insert inside fan casing (1 week). Tone eliminated, but harmonic remained, even when fan turned off
- Analysis 2: more detailed analysis showed harmonic was 2 blade pass tones from 2 other fans at 590Hz and 592Hz
- Solution 2: similar aerodynamic inserts in the other 2 fans
If this analysis had been carried out by the consultant to identify the cause of the complaints, the company would not have wasted money, EHO time and resources and the complaint would not have had to suffer unnecessarily for months.
Multiple source identification using tonal analysis - mills, vibratory screen and fans

Complex noise complaints, potentially due to multiple sources.
- Analysis: the noise complaints were caused by multiple tones
- Diagnosis 1: 4 tonal sources identified - vibratory screen (11.8Hz + harmonics), 2 filter fans and 2 mills
- Solution 1: aerodynamic insert inside fan casings, fan tones eliminated. Mills fitted with bespoke silencers to eliminate noise contributions
- Solution 2: low-cost engineering modifications to the vibratory sieve cut low-frequency tones by 50dB
The complaints had dragged on for many months without identification of the causes and hence no resolution. All the contributory sources were quickly identified using frequency signature analysis and hence the optimum (and very precise) mitigation could be designed.
Generator and chillers tonal source identification - blaming the wrong site

Tonal noise complaints had been attributed by the Environment Agency to noise from just one site due to the use of 1/3 octave analysis only. In fact, the problems were actually caused by 2 tones close together from 2 different sites. This initial misdiagnosis led to very long delays in mitigation and a huge waste of time and resources.
- Analysis: the noise complaints were in fact caused by 2 tones that sometimes show in the 80Hz 1/3 octave band as shown above
- Diagnosis 1: the 2 tonal sources were identified. 75Hz from a CHP generator set (this is a classic gen-set tone) and 71Hz from a chiller on another site

- Solution 1: tuned silencer fitted to the CHP engine exhaust, eliminating the tone (18dB attenuation)
- Solution 2: this would entail low-cost aerodynamic modifications to the chiller fans that would also increase fan efficiency and reduce running costs
Not using narrow-band frequency analysis as the basis for the investigation of this tonal noise complaint proved to be very costly. The Environment Agency spent considerable time and resources with multiple site visits and noise measurements. The company also invested time and resources in its attempts to track down and mitigate the problem.

When consulted, analysis of the recordings we requested quickly showed that:
- half the noise problem was a 75Hz gen-set tone (solved by fitting a tuned silencer)
- the other half to be a 71Hz chiller fan blade pass hum from an adjacent site.
Why smartphone FFT analysis is accurate. Ignore axe grinding naysayers...
Instrumentation suppliers, acousticians and their organisations often have very negative views on smartphone frequency analysis apps. These are typically centred on:
- Calibration: you can't calibrate the app and different phones have different microphones and they are not Type approved and noise floor and etc...
- Frequencies: they don't cover the whole frequency range and they don't have a flat frequency response and etc...
For the vast majority of uses for narrow band FFT analysis, neither of these sets of objections are relevant. They are based on a fundamental misunderstanding of the practical uses of smartphone frequency analysis apps either through ignorance or (enter cynical reason of choice)...?

BS4142 allows subjective tonal frequency analysis through simply listening or through unreliable 1/3 octave analysis. By comparison, smartphone FFT apps are incomparably more accurate and useful. The following explains why these objections are not relevant in virtually every case.
Calibration
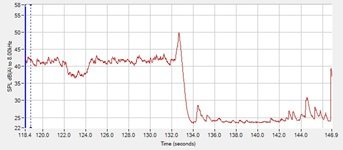
Provided the same phone is used with the same settings for 2 recordings (e.g. with and without the noise source), then what we are almost always concerned with are the changes in noise levels and features, NOT the absolute level. Ideally, turn off the Automatic Gain Control (AGC - this is done automatically in recording apps such as The Noise App), but in many cases, even without this, the results are accurate enough. This trace shows the 17dB change in noise level v time from a smartphone recording of water flow structural noise on and off in a flat.
So for most applications of this nature, whilst in very quiet environments the lowest level recorded may be influenced by the noise floor of the microphone, listening to and analysing the audio in the vast majority of cases will show a very accurate level difference.
In addition, the recorded level difference between an event and the sound before and after is accurate. In complaint cases, just listening to the recording will usually show whether it is a nuisance or not. Moreover, and as a very salient fact, you don't actually need objective evidence to judge noise to be a nuisance, just the subjective impression. Listening to a recording provides additional evidence.
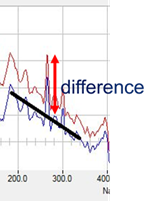
When considering narrow band frequency analysis of smartphone recordings, the tonal frequencies are extremely accurate (as accurate as any Type 1 system at the selected resolution) as is the level difference between the tonal peak and the broadband noise either side shown here. The latter automatically compensates for the microphone low -frequency roll-off. Those are the only measurement parameters of interest in almost every typical case, not the necessarily the absolute level of the tone.
Frequency range
To a large extent, this is a red herring. Whilst smartphones do have a significant (and varying between phones) roll-off at low frequencies, once again you are almost always not looking at the absolute levels but at changes in level. So a recording of a LF source on and off will show a change in level that is very accurate within the limitations of the microphone noise floor. Moreover, a high noise floor will reduce that difference, so if the recorded difference is large enough to constitute a nuisance, the reality (when using the most costly kit on the market) can only be worse i.e. it could only provide evidence of a greater level difference and hence greater nuisance.
Real world utility of smartphone analysis
We've successfully solved a host of noise problems across the planet using just smartphone recordings via our remote control of noise services. These have included:
- identification of LF tones (<50Hz) that are the cause of complaints
- identification of the sources of LF tones by comparing narrow band signatures
- identification of noise level changes due to intermittent sources (HVAC, power presses, pulsation pumps, vehicles, industrial impacts, exhausts etc) and ID of the sources
- used the FFT tonal analysis results to design the optimum mitigation measures (fans, pumps, chillers, compressors, power presses, exhausts etc)
We have also helped the Irish EA to include the use of smartphone recordings and analysis in their revised noise guidance instead of just relying on subjective evaluations.
These many projects prove just how well smartphone recording and analysis works in practice...
View our guide to using the best free Android FFT app here >
Webinars on audio diagnosis, including narrow band frequency analysis >
