
Posted on: April 29, 2026
Expressing 40 years of frustration since founding INVC... Peter Wilson
Observation: the global environmental noise industry is failing regulators, the public and companies due to a lack of effective diagnosis that results in serious health and financial costs. That noise mitigation solution? Probably a guess...
Q: not only why, but also WHY?
A: no diagnosis of the "complaint signature"
A: no diagnosis of the causes of the "complaint signature" to divine the optimum mitigation options
The diagnostic process that must always be followed is outlined below. Whilst I’ve focussed on complaints about existing noise issues, the same process is also applicable to noise specifications. Except for the simplest of cases, unless this process has been followed, any noise complaint evaluation or mitigation advice is based on guesswork.
The technology exists to resolve most environmental noise complaints quickly, cheaply, and sustainably. The failure to do so is not a technical problem, it is a failure of professional competence. It is time to stop paying for their mistakes.
Dear regulators...

You have the power to minimise this waste of everyone’s time, money and resources.
- Don’t accept reports that rely solely on broadband dB(A) figures. Send them back
- Reject any noise report that does not include a ranked diagnostic analysis of the precise cause(s) of the complaint
- Query any report that does not include the noise source diagnostic elements detailed below
- Please improve planning and other noise specifications to avoid future problems. More of this in a future post...
The diagnostic process for environmental noise

Avoid inappropriate BS4142-ing: when there have been complaints, a BS4142 assessment is unnecessary. We see so many reports based on costly and very time consuming 4142 assessments that come to the conclusion that “complaints are likely”. Quelle surprise! This takes us no closer to finding a solution and just delays mitigation. I know the EA can insist if there have been complaints - but that's just an unfortunate added bureaucratic cost...
Note: even though the following process can be carried out by non-noise-specialists, it is disappointingly rarely implemented by noise experts. It is only at the mitigation stage that specialist engineering expertise is needed.
1: Generate a “noise complaint / problem” signature (non-specialist)
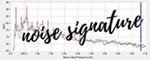
You need to understand the precise cause of the problem. Far too often the cause(s) are undiagnosed due to a fixation on dB(A).
This signature generation should always involve listening to the complainant and making audio recordings to facilitate subsequent alternative evaluations and narrow band frequency analyses. Asking the complainant to make smartphone video clips of the problem noise is a) good HR and b) saves you having to stand in the cold at 2am...
Broadband noise
The identification of broadband amplitude and/or temporal variation is not usually a problem as it's commonly included in reports as endless continuous monitoring system noise v time data. I have few complaints other than most of it being a costly un-unnecessity as you can usually get the data you need over quite short time periods. It's maddening to be asked to review months of dB(A) report monitoring data when the problem was caused by thumps generating < 50Hz that have zero impact on dB(A), particularly when the solution cost £300 and was fitted in 10 minutes...
Tonal noise
When it comes to tonal noise, most reports use "subjective impressions" or 1/3 octaves to determine if there are tones, neither of which is reliable. You should always carry out a narrow band analysis (it takes seconds) to confirm.
It's long past the time to address this particular elephant in the room - or rather, the humming, droning elephant that most of the acoustic consultancy industry seems determined to ignore.
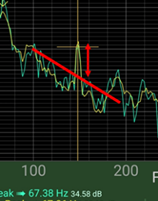
Smartphone apps work extremely well as in this picture showing both tonal amplitude above masking noise and the precise frequency to Type 1 accuracy. Pause while instrument suppliers and acousticians gnash their teeth. The proof of the pudding is that it works. It is highly effective and it's free...
Combine all this information to determine a precise, objective “complaint signature”.
Example: complaints re A/C plant on office block roof. £100k wasted

Post abatement notice, the company employed a large noise consultancy who BS4142-ed - but without a narrow band analysis. They recommended replacing a chiller with a 7dB(A) quieter model @ > £100k. Complaints continued as they were caused by LF tones from a different unit for which retrofit control measures were available to eliminate the problem at a cost of <£10k).
Despite intense competition, this is our current record holder for wasting client money…
More details of the noise problem signature generation process >>
2: Diagnose the precise cause(s) of the “complaint signature” features (non-specialist)
- Identify contributory site plant noise sources and characteristics, be it a simple takeaway café extract fan or from an entire industrial site
- Rank the sources – against noise specifications and by subjective effect - dB(A) and character at complainant, site boundary or other reference position
Frequency content – tonal
Narrow band analysis is by far the simplest diagnostic process, which is why I find it so depressing that it’s so uncommon. The precise frequency of a tone will match a mechanical or aerodynamic process on the culprit plant. Match the tone at the complainant to the plant generating the same frequency and you also have a precise guide as to how best to mitigate. QED.
If there are multiple contributory items of plant, rank them in order of their contributions.
Example: surgical diagnosis of multiple sources
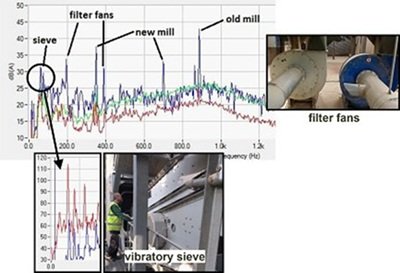
The precise causes of the noise complaints from a complex wood chip processing site with dozens of potential noise sources were rapidly identified and ranked using the narrow band frequency analyses shown here.
The primary sources were: 2 types of mill, 2 filter fans and a large vibratory sieve.
Despite generating inaudible infrasound (11.8Hz), the sieve was the dominant problem due to the pressure pulses rattling doors, plates etc. The mills were fitted with local silencing, aero technology was applied to the fans and the 11.8Hz hum cut by 50dB using low-cost engineering modifications.
More details of the noise problem signature generation process >>
3: Evaluate the optimal mitigation options (specialist expertise)
- Identify all potential noise sources within the dominant machine / process
- Rank these sources in terms of their contributions to the problem signature
- Establish the engineering noise source control options for the dominant source. Repeat for the next most dominant source. Only if the potential source control noise reductions are insufficient should you consider conventional palliatives such as enclosures, barriers, silencers etc.
Use these results to generate a cost benefit analysis of noise reduction options v cost based on Best Practicable Means (BPM) engineering, not just on costly conventional measures.
